giorgia lupi
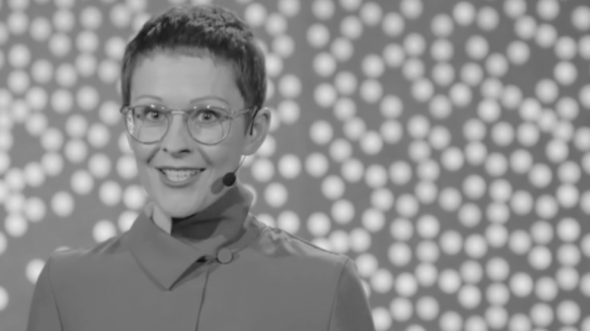
[brooklyn]
intro’d to Giorgia here: tedxnyc 2017 – how can we find ourselves in data
I run a data visualization design company, and we design and develop ways to make information accessible through visual representations.
data are always just a tool we use to represent reality. They’re always used as a placeholder for something else, but they are never the real thing.
This made people see the mission’s data from a very different perspective. It all suddenly became much more about our human nature and our curiosity, rather than technology.
human nature and curiosity.. as the day
perhaps rather than tech.. rather than numbers.. rather than legible..
working with data means designing ways to transform the abstract and the uncountable into something that can be seen, felt and directly reconnected to our lives and to our behaviors, something that is hard to achieve if we let the obsession for the numbers and the technology around them lead us in the process.
the legend for how to interpret our drawing………representing the details of my days and my personality through my data collection…..using data also to explore our minds and the words we use, and not only our activities.
idio jargon and beyond words ness
Over one year, the process of actively noticing and counting these types of actions became a ritual. It actually changed ourselves. We became much more in tune with ourselves, much more aware of our behaviors and our surroundings. Over one year, Stefanie and I connected at a very deep level through our shared data diary, but we could do this only because *we put ourselves in these numbers, adding the contexts of our very personal stories to them. It was the only way to make them truly meaning fuland representative of ourselves.
What we missed looking at these stories only through models and algorithms is what I call “data humanism.” In the Renaissance humanism, European intellectuals placed the human nature instead of God at the center of their view of the world. I believe something similar needs to happen with the universe of data. Now data are apparently treated like a God — keeper of infallible truth for our present and our future.
of math and men.. measuring things..
The experiences that I shared with you today taught me that to make data faithfully representative of our human nature and to make sure they will not mislead us anymore, we need to start *designing ways to include empathy, imperfection and human qualities in how we collect, process, analyze and display them. I do see a place where, ultimately, instead of using data only to become more efficient,we will all use data to **become more humane.
*host life bits that io dance
** 2 convos
______
@giorgialupi
In these dark times, how can we make peace with data? My take on
#datahumanism https://medium.com/@giorgialupi/data-humanism-the-revolution-will-be-visualized-31486a30dbfb#.73hgqusx9 … (originally published on@printmag)
from feb 2017
And visual design — with its
power to instantly reach out to places in our subconscious without the mediation of language,
and with its inherent ability to convey large amounts of structured and unstructured information across cultures — is going to be even more
central to this silent but inevitable revolution.
visual..and/or just..beyond words
What made cheap marketing infographics so popular is probably their biggest contradiction: the false claim that a couple of pictograms and a few big numbers have the innate power to “simplify complexity.” The phenomena that rule our world are by definition complex, multifaceted and mostly difficult to grasp, so why would anyone want to dumb them down to make crucial decisions or deliver important messages?
It is a snapshot of the world in the same way that a picture catches a small moment in time.
hmm.. i don’t think so
Sketching with data — so, in a way, removing technology from the equation before bringing it back to finalize the design with digital tools — introduces novel ways of thinking, and leads to designs that are uniquely customized for the specific type of data problems we are working with.I draw to freely explore possibilities. I draw to visually understand what I am thinking, I draw to evaluate my ideas and intuitions by seeing them com- ing to life on paper, I draw to help my mind thinking without limitations, without boundaries
so… like idio jargon… idio sketching.. which to me.. sketching is part of idio jargon
*Drawing with data is an invaluable tool to discover what is unique about the numbers at hand. It also raises new questions about the data itself. This limiting practice helps to reveal new possible analyses to perform: **Instead of being overwhelmed by the size of a dataset and by millions of numbers, we focus only on their nature, their organization, and doing so often opens new opportunities originating from this vantage point.
*and/or to disengage from the numbers.. [feeling more important to do w/o numbers than w/o tech.. ie: we need the tech to facil the chaos of the idio ness]
**and/or.. we don’t focus on the data at all.. we just give it up.. via self-talk .. everyday.. and the mech sends us back potential connections.. locally.. to me.. that’s the humane ness that we’re missing.. connecting with people/tribes.. as the day… a quiet revolution .. of everyday life
they draw on common perception principles and use simple shapes, select symbols and a definite range of colors to create basic visual compositions that deliver a message and please the eye.
thinking iconspeak
from quantity, we can get closer to quality.
thinking ginorm/small
How a dataset is collected and the information included — and omitted — directly determines the course of its life….This is why we have to reclaim a personal approach to *how data is captured, analyzed and displayed, proving that subjectivity and context play a big role in understanding even big events and social changes — especially when data is about people
this is why self-talk as data is so huge.. data matters very little.. and can do harm.. if it’s about not-us.. which ongoingly perpetuates not-us ness.. via broken feedback loop
We have to find new languages, and explore how to convey knowledge and inspire feelings simultaneously with data
______
find/follow Giorgia:

Information designer. Co-founder and Design Director at Accurat (
@accuratstudio). Co-author of Dear Data (@_deardata) published by@penguinUKbooks and@PAPress
I am an information designer, artist, and author.
Data is my tool, medium, and material to tell stories.
With my practice, I create visual languages to represent data to make them more contextual, engaging, and human.
___________
data
talk to self daily.. (hlb trail ie’s)
like this: a nother way